
There is something strangely satisfying about watching a messy collection of numbers turn into a clear statistical story. At first, a data set can look like nothing more than scattered observations sitting on a page.
Then the Variance Calculator steps in, measures how far those values wander from their mean, and suddenly the numbers begin telling us whether they are huddled together or wandering all over the place.
Variance is one of those statistical ideas that sounds more complicated than it really is. In simple terms, variance measures the spread of numerical data by finding the average of the squared deviations from the mean.
A small variance suggests that values stay relatively close to the average, while a larger variance means the observations are more widely dispersed. That’s the basic heartbeat of the whole idea.
Whether you’re working with classroom test scores, monthly returns, manufacturing measurements, scientific experiments, or an ordinary numeric data set, understanding variance can make statistical analysis much easier.
And yes, the first time you see all those symbols s², σ², xᵢ, x̄, μ, and Σ it can feel like mathematics has suddenly started speaking another language. It hasn’t, really.
| Term | Short Definition |
|---|---|
| Variance | Measures how spread out data is from the mean. |
| Mean | The average of all values in a dataset. |
| Population Variance | Variance calculated using the entire population. |
| Sample Variance | Variance estimated from a sample of data. |
| Standard Deviation | The square root of variance. |
| Formula | Variance = Average of squared deviations from the mean. |
What Is a Variance Calculator?
A Variance Calculator is a statistical tool designed to calculate the amount of variability or spread within a set of numbers.
Instead of manually finding the arithmetic mean, subtracting that mean from every observation, squaring each difference, adding everything together, and then dividing by the appropriate divisor, the calculator handles those steps for you.
The result is called statistical variance, a common statistical measure used in descriptive statistics and broader statistical analysis.
The calculator may determine either sample variance or population variance, depending on whether your numbers represent a sample or the complete population being studied.
For example, imagine five classroom test scores: 70, 72, 75, 78, and 80. They don’t sit at exactly the same point, but they aren’t wildly separated either.
Variance gives us a numerical way to describe that spread rather than simply saying, “Well, the scores look kinda close.”
A calculator can therefore be useful when you need a quick variance calculation, especially when the data set contains many observations.
How Variance Measures the Spread of Data
The central idea behind variance is wonderfully simple: compare every value with the average.
First, calculate the mean. Then determine each observation’s deviation from the mean. Because positive and negative deviations would otherwise cancel each other out, each deviation is squared.
These are the squared differences, and their total forms the sum of squared deviations or sum of squares.
The final division depends on whether you are dealing with a sample or an entire population.
In everyday language, variance answers a question like this:
“How far do these numbers tend to move away from their average, once those differences are squared?”
That little question is doing a surprising amount of statistical work.
A small variance means the values are generally clustered around the mean. A large variance indicates greater dispersion. If every observation is identical, the variance is zero because there is no spread at all. That’s about as peaceful as a data set can get.
Sample Variance and Population Variance

One of the most important things to understand when using a Variance Calculator is the difference between sample variance and population variance. They look almost identical, but their divisors are different, and that difference matters.
Sample Variance
Sample variance is used when your observations represent a smaller random sample drawn from a larger population.
Its formula is:
s² = Σ(xᵢ − x̄)² / (n − 1)
Here, s² represents sample variance, xᵢ represents an individual observation, x̄ is the sample mean, and n is the sample size.
The divisor is n 1, rather than n. This adjustment is called Bessel’s correction. It helps make sample variance an unbiased estimator of the population variance under the usual random-sampling assumptions.
So if you are studying the heights of 100 randomly selected students to learn about a much larger student population, you would generally use the sample approach.
Population Variance
Population variance is used when your data includes the entire complete population of interest.
Its formula is:
σ² = Σ(xᵢ − μ)² / N
Here, σ² represents population variance, μ is the population mean, and N represents the total population size.
There is no n 1 adjustment because you are not estimating an unknown population parameter from a sample. You’ve already got the whole group.
This distinction is small on paper but important in real statistical work.
How to Calculate Variance Step by Step
Learning how to calculate variance manually is useful even if you normally use an online calculator. It helps you understand what the tool is actually doing behind the scenes.
Suppose your data set is:
4, 6, 8, 10, 12
First, calculate mean:
(4 + 6 + 8 + 10 + 12) ÷ 5 = 8
The mean is therefore 8.
Next, find the deviation of every number from 8:
4 − 8 = −4
6 − 8 = −2
8 − 8 = 0
10 − 8 = 2
12 − 8 = 4
Now square those deviations:
16, 4, 0, 4, 16
The sum of squared deviations is:
16 + 4 + 0 + 4 + 16 = 40
For population variance, divide by N:
40 ÷ 5 = 8
So the population variance is 8.
For sample variance, divide by n − 1:
40 ÷ 4 = 10
So the sample variance is 10.
The same observations can therefore produce two different variance values depending on what those observations represent. Numbers, annoyingly but correctly, care about context.
Variance Formula Explained
The variance formula is simply a compact description of the calculation process.
The population version is:
σ² = Σ(xᵢ − μ)² / N
The sample version is:
s² = Σ(xᵢ − x̄)² / (n − 1)
The symbols can look intimidating, but each one has a job.
Σ means add everything together.
xᵢ means an individual data point.
μ means the population mean.
x̄ means the sample mean.
N is population size.
n is sample size.
n 1 is the divisor used with the Bessel correction.
Once you decode those symbols, the formula becomes much less mysterious.
Variance and Standard Deviation

Variance is closely connected to standard deviation, but the two are not interchangeable.
The standard deviation formula is essentially the square root of variance:
σ = √σ²
for a population, and:
s = √s²
for a sample.
This difference in units is important. Variance has squared units, while standard deviation has the same original units as the observations.
For example, if you measure distance in meters, variance is expressed in meters squared, while standard deviation is expressed in meters. If you measure exam scores in points, variance is in points squared, while standard deviation is in points.
This is one reason standard deviation is often easier to interpret.
The relationship can be remembered as:
Variance → squared spread
Standard deviation → spread in original units
Simple enough, once the statistical fog clears a little.
When Should You Use a Variance Calculator?
A variance calculator with data becomes especially useful when your list contains many observations. Manually calculating 10 values isn’t terrible. Manually calculating 500 values, however, is where patience starts quietly packing its suitcase.
An online sample variance calculator can help when you need to calculate sample variance from survey responses, test scores, measurements, or research observations.
A population variance calculator is appropriate when the numbers represent every member of the population you are studying.
Variance calculators are also useful for checking homework, validating spreadsheet calculations, exploring statistical variance examples, and quickly comparing the variability of several data sets.
Still, a calculator should not replace understanding. It should make the arithmetic easier while leaving the statistical reasoning in your hands.
Variance Has Squared Units
One unusual feature of variance is that its units become squared.
If your original observations are in dollars, the variance is in dollars squared. If measurements are in centimeters, the variance is in centimeters squared.
That doesn’t mean anyone walks around saying, “The variance is 14 dollars squared,” during ordinary conversation. Instead, analysts often use standard deviation when communicating the amount of spread because it returns the measurement to its original units.
This is a useful point when interpreting results. A variance value by itself doesn’t always feel intuitive, but it remains mathematically powerful.
Large Variance, Small Variance, and Zero Variance
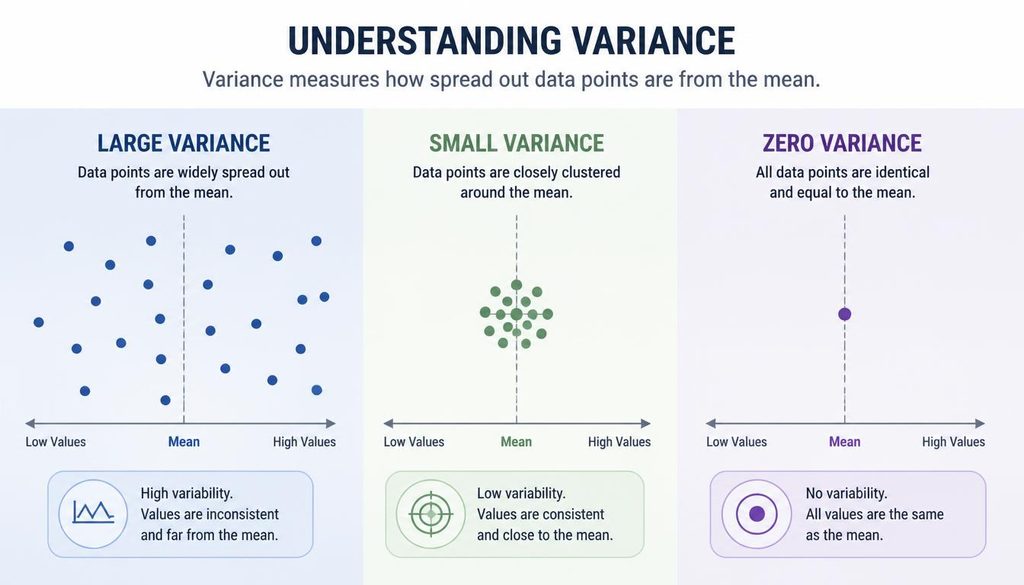
A small variance indicates that observations tend to remain near the mean. Imagine exam scores of 78, 79, 80, 81, and 82. The values are close together, so their variance will be relatively small.
A large variance occurs when observations are more widely dispersed. Consider 20, 50, 80, 110, and 140. Those values stretch much farther from their mean.
A zero variance is even simpler. If every observation is exactly the same, every deviation from the mean is zero, so the variance is zero.
Variance therefore gives us a numerical description of data variability, rather than merely relying on our eyes to judge whether values look scattered.
The Effect of Outliers on Variance
One of the most important characteristics of variance is its sensitivity to outliers.
Because deviations are squared, an observation that is very far from the mean can have a disproportionately large effect on the result. This is called outlier sensitivity, and it explains why a single unusual observation can substantially increase variance.
Suppose most monthly returns are between 2% and 5%, but one month records 25%. That unusual value may strongly affect the variance of stock returns.
This isn’t necessarily a flaw. Sometimes the extreme value is precisely what you want to notice. In financial analysis, manufacturing, medicine, and experimental science, unusual observations may contain meaningful information.
The key is knowing why the outlier exists before deciding how to interpret it.
Variance Compared With Mean Absolute Deviation
Variance isn’t the only way to measure spread.
Mean absolute deviation calculates the average absolute distance between observations and the mean. Variance instead squares those deviations.
That creates an important difference:
- Mean absolute deviation treats deviations according to their absolute size.
- Variance gives greater influence to larger deviations because they are squared.
- Standard deviation converts variance back into the original measurement units.
This is why mean absolute deviation vs variance can produce different perspectives on the same data distribution.
Neither measure is automatically suitable for every situation. The appropriate choice depends on the purpose of the statistical analysis.
Weighted Variance and Data With Frequencies

Not every data set gives every observation equal importance.
Sometimes data comes with frequencies, weights, or repeated observations. In such cases, a weighted variance approach may be appropriate.
For example, if a survey records a score of 80 from 100 people and a score of 90 from 5 people, treating those two values as equally frequent would misrepresent the data.
A weighted variance formula accounts for the relative importance or frequency of observations. By contrast, unweighted variance treats each listed observation equally.
This distinction becomes especially useful in survey analysis, economics, education, and large statistical data sets.
Variance, Covariance, and Multiple Variables
When more than one variable is involved, variance connects naturally with covariance.
For example, the variance of a sum can be expressed as:
Var(X + Y) = Var(X) + Var(Y) + 2Cov(X,Y)
If variables are independent, their covariance is zero, so the relationship becomes:
Var(X + Y) = Var(X) + Var(Y)
However, when variables are correlated variables, the covariance term matters.
This concept appears in portfolio analysis, regression, experimental design, and many other areas of mathematical statistics. Variance is therefore not just a one-variable idea; it becomes part of a much larger statistical language.
Variance in ANOVA and Regression
In ANOVA, or analysis of variance, researchers examine variation within groups and variation between groups.
The basic concepts include:
- within-group variance
- between-group variance
- total variance
- variance decomposition
The purpose is not simply to calculate one variance number. Instead, ANOVA helps researchers investigate whether observed differences between groups are associated with systematic variation rather than ordinary random variability.
Variance also appears heavily in regression and least-squares regression. The idea of minimizing squared errors is deeply connected to the same mathematical structure behind variance.
Even gradient methods and numerical optimization can involve squared-error objectives, which is another reason the humble squared deviation keeps showing up in statistics and computational mathematics.
Numerical Stability and Two Pass Calculation

For very large data sets, calculating variance requires more care than simply plugging numbers into a basic formula.
A direct calculation can sometimes suffer from floating-point issues, particularly when values are very large but their differences from the mean are relatively small. This is where numerical stability becomes important.
A two-pass variance calculation is one common approach. The first pass calculates the mean, and the second pass calculates the squared deviations from that mean.
More specialized algorithms can calculate variance efficiently while reducing numerical error, which matters in scientific computing and large-scale statistical software.
The little formula from the classroom therefore has a much bigger computational life than it first appears.
Real-World Uses of Variance
Variance isn’t trapped inside mathematics textbooks. It quietly works behind many real-world decisions.
In portfolio theory, variance helps describe financial risk and the variability of asset returns.
Investors and analysts may use variance and volatility as part of mean variance optimization, alongside measures such as the Sharpe ratio and concepts associated with the capital asset pricing model (CAPM).
In quality control, process variance helps manufacturers understand whether production measurements remain consistent.
For example, the diameters of CNC machined parts can be measured repeatedly to assess manufacturing consistency, process capability, and tolerance performance involving Cp and Cpk.
In signal processing, analysts study signal variance, noise variance, signal power, and the signal-to-noise ratio to understand how much unwanted variation exists within a signal.
In experimental science, repeated or replicate measurements can reveal how consistent an instrument or procedure is.
In evolutionary biology and quantitative genetics, researchers may discuss genetic variance, phenotypic variance, and heritability to study variation among biological traits.
Even classroom test scores can be analyzed through variance to understand whether students’ results are tightly grouped or widely dispersed.
Measurement Uncertainty and Error Propagation
Scientific measurements are never perfectly free from uncertainty. Instruments have limitations, observations vary, and repeated measurements may not be identical.
Variance can therefore contribute to the analysis of measurement uncertainty and error propagation.
Imagine measuring the same physical object several times. If the measurements bounce between slightly different values, the variance helps describe the degree of variation.
In a laboratory, this information can be important when deciding whether differences between measurements are meaningful or simply part of normal measurement variability.
Again, variance doesn’t magically explain every source of error. It provides one mathematical lens through which variability can be examined.
Variance in Finance and Stock Returns

Financial data is particularly suited to variance analysis because prices and returns naturally fluctuate.
Suppose you have a sequence of monthly returns for a stock. Calculating the variance of stock returns provides a measure of how widely those returns vary around their average return.
Higher return variance generally corresponds to greater variability, while lower variance indicates that returns have historically clustered more closely around their average.
Financial professionals often convert variance into standard deviation or volatility because the original-unit interpretation is easier to communicate. Still, variance remains central to portfolio mathematics and risk modeling.
A Practical Variance Calculation Example
Let’s make the whole process feel less like a textbook and more like something you might actually encounter.
Suppose five students receive the following exam scores:
65, 70, 70, 75, 80
The mean is:
(65 + 70 + 70 + 75 + 80) ÷ 5 = 72
The deviations from the mean are:
−7, −2, −2, 3, 8
Their squared deviations are:
49, 4, 4, 9, 64
The sum of squared deviations is:
130
For population variance:
130 ÷ 5 = 26
For sample variance:
130 ÷ 4 = 32.5
So the population variance is 26, while the sample variance is 32.5.
The difference isn’t an arithmetic mistake. It comes from choosing a different statistical interpretation of the same observations.
Related Statistical Calculators
Variance rarely lives alone. Depending on the problem you’re solving, other tools can complement it.
A Statistics Calculator may provide several descriptive measures together, including mean, median, range, variance, and standard deviation.
A Z-Score Calculator helps determine how far an observation lies from a mean in standard deviation units.
A Percent Error Calculator is useful when comparing an experimental result with an accepted or reference value.
A Linear Interpolation Calculator helps estimate a value between known data points.
A Logarithm Calculator handles logarithmic calculations that frequently appear in mathematics, science, and statistical modeling.
Using the right calculator for the right question saves time and, more importantly, prevents you from trying to force one statistical tool into a job it wasn’t designed to do.
Common Mistakes When Calculating Variance

There are a few mistakes that appear again and again.
One is forgetting to square the deviations. Another is using n when the problem requires n 1. A third is confusing sample variance vs population variance.
Some people also calculate the variance correctly but interpret it as though it were standard deviation. Remember, variance is expressed in squared units, while standard deviation is expressed in the original units.
Another common mistake is ignoring outliers. Since large deviations are squared, unusual observations can have a strong effect on the final value.
And perhaps the most human mistake of all is entering one number incorrectly into the calculator. Statistical tools are quick, but they don’t know that your keyboard betrayed you.
How to Interpret Variance Correctly
The number produced by a Variance Calculator needs context.
A variance of 25 might be very large for one data set and extremely small for another. There is no universal threshold that says, “25 means high variation.”
Interpretation depends on the scale of the original measurements, the subject being studied, and the purpose of the analysis.
For a useful interpretation, consider:
- What are the original units?
- Is the data a sample or a population?
- How large is the variance relative to the mean?
- Are there important outliers?
- How does the variance compare with another relevant data set?
- Would standard deviation be easier to interpret?
Statistics becomes much more meaningful when the number is connected back to the real-world question.
Why a Variance Calculator Is Useful
A good Variance Calculator does more than save a few minutes of arithmetic. It gives students, researchers, analysts, teachers, and professionals a quick way to verify their calculations and explore data variability.
For small data sets, it can act as a convenient checker. For larger data sets, it becomes a practical way to avoid repetitive arithmetic.
The most valuable habit is to understand what the result means before accepting it. A calculator can produce 18.7 very quickly. It cannot tell you whether 18.7 matters in your particular situation. That part still belongs to the person asking the question.
Frequently Asked Questions
What Is a Variance Calculator?
A Variance Calculator calculates how much the values in a dataset differ from their average.
How Do You Calculate Variance?
Variance is calculated by finding the mean, measuring each value’s deviation, squaring them, and averaging the squared deviations.
What Is the Difference Between Population and Sample Variance?
Population variance uses all data values, while sample variance estimates variance from a subset of a larger population.
Why Is Variance Important?
Variance shows the spread of data and helps identify how far values typically differ from the mean.
Can a Variance Calculator Handle Multiple Values?
Yes, you can enter a dataset with multiple values to quickly calculate its variance.
Read This Blog:https://wevorix.com/random-state-generator/
Final Thoughts on Variance
Variance is ultimately a story about distance from the average. Every observation moves away from the mean by some amount, those differences are squared, and the resulting average gives us a mathematical description of spread.
Whether you’re studying exam scores, measurement data, stock returns, manufacturing consistency, experimental observations, or a simple classroom exercise, the same core idea keeps appearing.
Use sample variance when your observations represent a sample and you are estimating a larger population. Use population variance when your data represents the complete population of interest.
Remember Bessel’s correction, understand why n − 1 appears, and keep in mind that variance uses squared units while standard deviation returns to the original units.
Most importantly, don’t let the symbols scare you. s², σ², Σ(xᵢ x̄)², n 1, and N may look like a tiny mathematical jungle at first, but each symbol has a very ordinary job.
A Variance Calculator simply makes that journey quicker. The real skill is knowing where the numbers came from, what they represent, and what their spread is quietly trying to tell you.
And once you see variance that way, statistics becomes a little less like a wall of formulas and a little more like listening carefully to what your data has been saying all along.
